Simple Slide from Excel on History of Technology
Winner
Want to win a job like this?
This customer received 15 graphic designs from 5 designers. They chose this graphic design from vayartstudio as the winning design.
Join for free Find Design Jobs- Guaranteed
-
 US$200
-
 15 designs
-
 5 designers
Graphic Design Brief
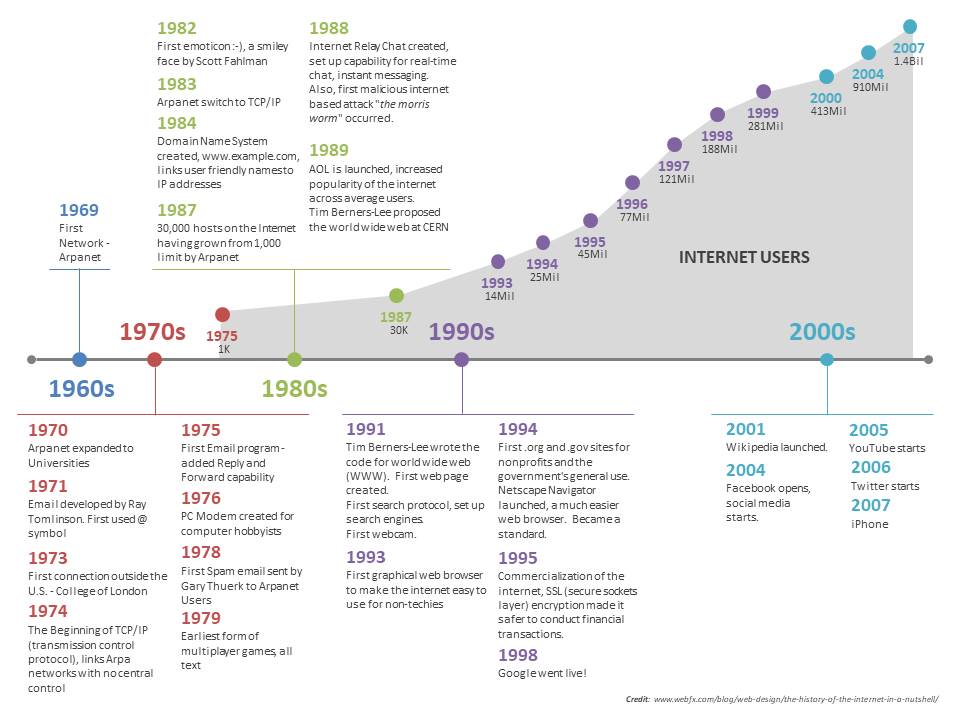
I need to convert this timeline into a more readable and friendly slide for a report I am doing. It is in Excel format. Feel free to cut some of the words and make it more simple. It can be in Word, powerpoint or excel.
Target Market(s)
a school paper, a professor will see
Requirements
Must have
- should give a feeling of momentum over time. Please add the number of internet users for each year it is available as 1,000 in 1975, 30,000 in 1987, 14 million in 1993, 25 million in 1994, 45 million in 1995, 77 million in 1996, 121 million in 1997, 188 million in 1998, 281 million in 1999, 413 million in 2000, 910 million in 2004, 1.4 billion in 2007
Files
XLSX
history of the internet - Hunter Walker
Sunday, March 15, 2020
Payments
1st place
US$100
2nd place
US$100